Est. Cda & Crr from Giro de Italia - Opening stage TT 2019
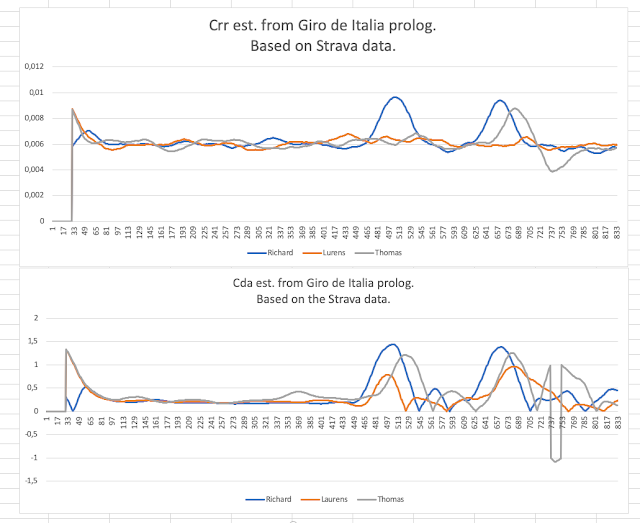
Just for the sake of it, I though it would be fun to try to estimate the professional riders Cda and Crr with the same estimation approach I am using in the Aero - Cda & Crr estimation app. I went for the Giro d'Italia 2019 Stage 1 segment from Strava and choosed three riders from the segment for comparison. Furthermore, for plotting the riders weight I Googled them and used the weight listed there and added 7.5kg, which is roughly what the riders TT bikes weights. Additionally, I didn´t have any weather data of that day, so I assumed there was zero wind for all the riders. Here is the result:

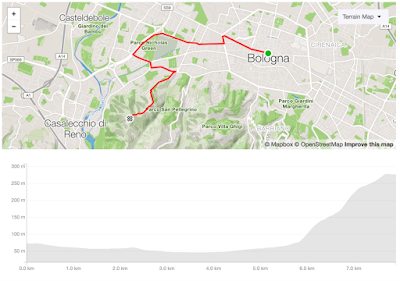
By looking at the data you can see that the Cda spikes heavily after 450 seconds, 7.5 minute. The reason is that they are going into a pretty steep hill after 6km of riding with an 180 degree turn (look at the course elevation below). Here the riders are probably braking before the corner and it affects the estimation. Another reason is that the estimation works best when there is higher speeds. You can see the course elevation here:

By looking at the flat part of the course, you can see the riders have an impressive Cda. Anyway, it is possible to distinguish who has the best Cda. By looking at the chart you can see that Richard has a faster Cda than the others and the Crr are on par. It is important to remember that this is just an estimate and it may not be correct and riders may experience wind gusts etc. that I have not taken into account. Richard has also the fastet time on the segment of the three riders listed above. Pretty interesting to see and it may not be a coincidence that he won the Giro by that level of detail!

Comments
Post a Comment