Validating the Cda and Crr estimation (with Vuelta Opening Team Time Trial Data)
One key factor of measuring Cda and Crr is obtaining valid numbers. The problem with live Cda and Crr testing is that there are so many factors to take into account, so it's difficult to say wether or not the estimations obtained are accurate. With the Virtual Elevation Monte Carlo approach there is basically no way of saying how accurate the estimations are. Of course, you can compare the guessed slope against the real one, but that's not a consistent way of testing. Neither does it provide a method of saying that the last x seconds of data/forces correlates with the incoming ones.
Therefore, in the last couple of months I have tried to implement the Linear Regression approach to obtain R squared. By checking against the R squared I can determine if the numbers obtained are trustworthy. I can be sure spikes in data or data loss doesn't affect my interpretation of the data. This will also ensure consistency of the Cda and Crr test runs over time.
The Linear Regression approach is often used in the velodrome testing of Cda and Crr (apparently what Garmin and AeroCoach are using). However, in the real world outside you have to take parameters like terrain and wind speed into account. Then the math gets a bit funky. At my first test runs outside I got numbers all over the place. So instead of testing outside, I started doing simulations inside. After using larger data sizes in the estimations, I started to get pretty decent numbers. Additionally, like Liversedge has stated at the GoldenCheetah repo, we could put bounds on the Crr with trading off some variance in the Cda estimation at the cost of potential bias in the Crr estimation. By setting these bounds on the Crr the estimations were nearly on par with the Virtual Elevation approach.
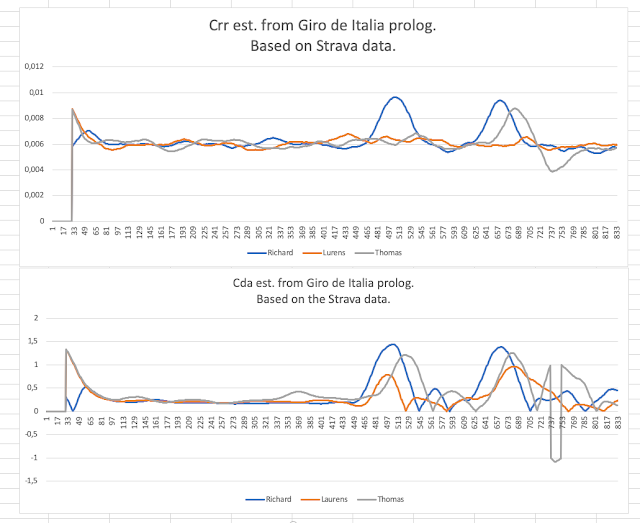
I have delayed this post on purpose to be after the Vuelta Opening Team Time Trial Stage to try this Linear Regression implementation on the professional riders and see how well it compares to the Virtual Elevation approach. For plotting the rider's weight I just Googled them and used the weight listed there like I did last time and added 8kg, which is roughly what the riders TT bikes and equipment weights. The weather data was pulled from the internet and I used a 30 second average of the data. Here is what the Wolfpacks Cda and Crr data looked like:

What strikes me at the first glance is how the Cda of the rider's spikes in order! This is probably when the rides are changing from drafting in the pack to being the front leader. It just shows how much harder it is leading the pack relative to being behind. If we look closer at the R squared compared to the data spikes in the Cda we can see R squared gets pretty low. That totally makes sense, since the previous forces of drafting should not correlate with the forces needed to lead the pack. Another neat observation is that when the riders have established their current position in the pack you can see that the R squared gets above 90%, which is pretty significant given the circumstances of this event with accelerations, wind turbulence behind the riders and the inconsistent power output. This high R squared shows that the Cda and Crr estimations are very close to the reality. A further observation is that all the riders R squared goes synchronously down after 3 minutes and 10 minutes:
 |
| After 3 minutes you have a 90 degree corner, where the riders are probably braking. |
 |
| At the 10 minute mark the Wolfpack have passed a very technical part at the turning point of the course. |
Okay, with the understanding of what the R squared means, lets' check out how well the Linear Regression approach compares to the Virtual Elevation. Here is the virtual elevation approach for the Wolfpack:

These estimations compare well with the Linear Regression approach. There is however a minor detail, which you can see here:

By looking at the comparison you can see that the Linear Regression reacts a bit slower on the Cda changes by the rider. However, the Linear Regression approach gives a better understanding of how well the latest x second of data/forces correlates on the rider. This is useful when analyzing afterwards to understand if the estimations are solid. R squared ensures the data integrity and consistency for analyzing. With this consistency you can for sure be able to determine pretty accurately how your Cda and Crr changes over time and be assured that there is a good validation of the data.
Comments
Post a Comment