Posts

The New Elevation Correction Feature (NASA SRTM data)

Image
If you are starting and ending your ride at the same location with different altimeter readings, you know something is off with the altimeter. From my personal Cda & Crr testing the altimeters can be quite inconsistent, especially in some climates. Some days the altimeter is working fine, but other days it is just a steady line or drifting. Therefore, I have in the last couple of months worked on implementing an Elevation Correction feature. My goal here has been to be able to obtain the elevation correction values live while cycling outside, so your on the fly estimations is not affected by the inconsistent altimeter readings. NASA has released an open source dataset of nearly the whole world called SRTM. It consists of elevation readings in a high-resolution digital database. It is astonishing what they have achieved. By using this SRTM data I have been able to accurately obtain elevation data across the whole globe. The Android phone app will download the data a

Validating the Cda and Crr estimation (with Vuelta Opening Team Time Trial Data)

Image
One key factor of measuring Cda and Crr is obtaining valid numbers. The problem with live Cda and Crr testing is that there are so many factors to take into account, so it's difficult to say wether or not the estimations obtained are accurate. With the Virtual Elevation Monte Carlo approach there is basically no way of saying how accurate the estimations are. Of course, you can compare the guessed slope against the real one, but that's not a consistent way of testing. Neither does it provide a method of saying that the last x seconds of data/forces correlates with the incoming ones. Therefore, in the last couple of months I have tried to implement the Linear Regression approach to obtain R squared. By checking against the R squared I can determine if the numbers obtained are trustworthy. I can be sure spikes in data or data loss doesn't affect my interpretation of the data. This will also ensure consistency of the Cda and Crr test runs over time. The Linear Regressi

Est. Cda & Crr from Giro de Italia - Opening stage TT 2019

Image
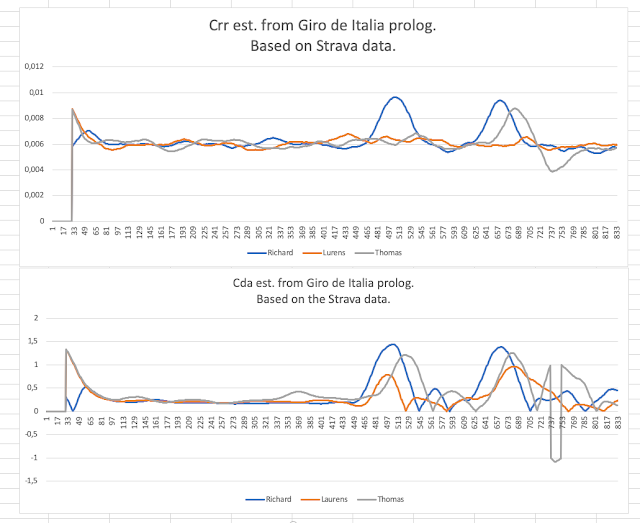
Just for the sake of it, I though it would be fun to try to estimate the professional riders Cda and Crr with the same estimation approach I am using in the Aero - Cda & Crr estimation app. I went for the Giro d'Italia 2019 Stage 1 segment from Strava and choosed three riders from the segment for comparison. Furthermore, for plotting the riders weight I Googled them and used the weight listed there and added 7.5kg, which is roughly what the riders TT bikes weights. Additionally, I didn´t have any weather data of that day, so I assumed there was zero wind for all the riders. Here is the result: By looking at the data you can see that the Cda spikes heavily after 450 seconds, 7.5 minute. The reason is that they are going into a pretty steep hill after 6km of riding with an 180 degree turn (look at the course elevation below). Here the riders are probably braking before the corner and it affects the estimation. Another reason is that the estimation works best when there is

Aero - Cda & Crr estimation - Privacy Policy

This app uses the microphone to record some features if you accept it and it is a sensitive permission request.